Deploying AI Workflows on Cloud Run: Latency, Cold Starts, and Scaling
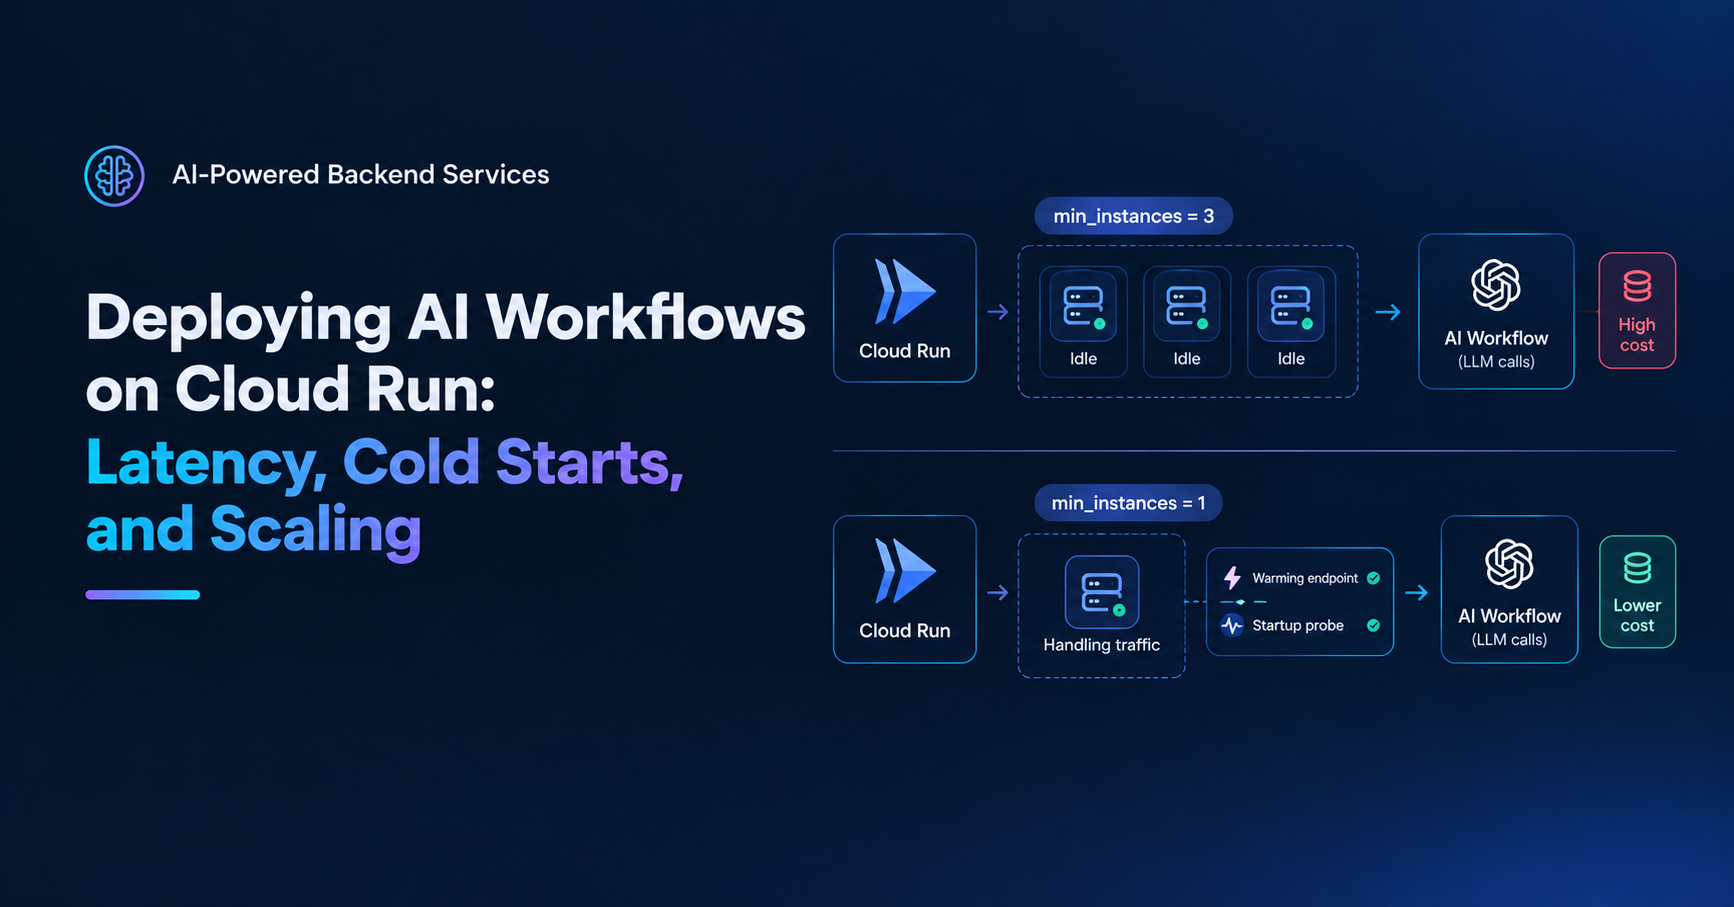
The team set min_instances = 3 to eliminate cold starts on the AI workflow service. Reasonable thinking — LLM calls already add 5–15 seconds of latency, a 4-second cold start on the first request after a quiet period makes the experience unusable.
Three months later, that one service accounted for 40% of the total Cloud Run bill. Three instances running 24 hours a day, seven days a week, mostly idle — because the actual traffic arrived in bursts during business hours and the service sat dormant overnight.
The fix was min_instances = 1 with a warming endpoint called by the deploy pipeline, and a startup probe tuned to the service's actual initialisation time. Identical user experience. A third of the cost.
Why AI Services Have Different Deployment Characteristics
A standard FastAPI service starts in under a second. An AI workflow service might take 3–8 seconds to start — importing the OpenAI SDK, loading prompt configs from disk, establishing the database pool, and initialising any local models or embeddings.
Traffic patterns are also different. AI features tend to be used during active working hours and sit idle overnight. A standard API might have consistent baseline traffic. An AI workflow service might have zero requests for six hours and then a spike.
These two characteristics — slow cold start, bursty traffic — are in tension with each other. The naive fix (more min instances) solves the latency problem and creates a cost problem.
Cold Starts — The Actual Numbers
Cloud Run cold start time for an AI workflow service has three components:
Instance provisioning (~1–2 seconds): Cloud Run allocates and starts the container. This is mostly fixed regardless of your application.
Application initialisation (variable): importing packages, loading configs, establishing connections. For a FastAPI service with OpenAI SDK, Pydantic, SQLAlchemy, and a DB pool: typically 2–5 seconds.
First request processing: the first LLM call after startup is sometimes slower than subsequent ones due to connection establishment with the OpenAI API.
Measure your actual cold start time with structured logs:
# main.py
import time
import logging

logger = logging.getLogger(__name__)
_start_time = time.time()

@asynccontextmanager
async def lifespan(app: FastAPI):
    app.state.db = await init_pool(settings.database_url)
    startup_duration = time.time() - _start_time
    logger.info("startup_complete", extra={"startup_seconds": round(startup_duration, 2)})
    yield
    await app.state.db.close()
Query Cloud Logging for startup_seconds over a week to understand your real distribution. Don't guess.
The min_instances Tradeoff
The formula:
cost_of_cold_start_experience = cold_start_latency × cold_start_frequency × user_impact
cost_of_min_instances = instance_hourly_cost × min_instances × 24 × 30
For most AI workflow services, min_instances = 1 is the right answer — it eliminates the majority of cold starts (only the very first request after a scale-to-zero event hits a cold instance) at a fraction of the cost of min_instances = 3.
# modules/cloud_run/variables.tf
variable "min_instances" {
  type        = number
  description = "0 for dev (scale to zero), 1 for prod (eliminate most cold starts)"
  default     = 0
}

variable "max_instances" {
  type        = number
  default     = 10
}
# environments/prod.tfvars
min_instances = 1
max_instances = 20
For the remaining cold starts — the first request after a new deployment, or after a genuine scale-to-zero — a warming endpoint handles it:
# routers/health.py
@router.get("/warm")
async def warm(request: Request):
    """Called by the deploy pipeline post-deploy to pre-warm the instance."""
    # Make a minimal LLM call to establish the API connection
    await call_model(
        prompt="Say 'ready'.",
        system="You are a health check assistant.",
        model="gpt-4o-mini",
        max_tokens=5,
        feature="warmup"
    )
    return {"status": "warm"}
# .github/workflows/deploy.yml
- name: Deploy to Cloud Run (no traffic)
  run: |
    gcloud run deploy pulsecart-ai-worker \
      --image gcr.io/$PROJECT/ai-worker:$SHA \
      --no-traffic

- name: Warm new revision
  run: |
    NEW_URL=$(gcloud run revisions describe ... --format 'value(status.url)')
    curl --fail "$NEW_URL/warm"

- name: Shift traffic
  run: gcloud run services update-traffic pulsecart-ai-worker --to-latest
The warming call runs before traffic shifts. The first real user request after a deploy hits an already-warm instance.
Latency Profiling
LLM calls dominate latency but aren't the only contributor. Profile each stage:
# services/extraction.py
import time

async def extract_document(document_text: str) -> ExtractionResult:
    timings = {}

    t0 = time.time()
    prompt_config = get_prompt("document_extraction")
    timings["prompt_load_ms"] = round((time.time() - t0) * 1000, 1)

    t1 = time.time()
    raw = await call_model_with_retry(
        prompt=prompt_config["user_template"].format(document=document_text),
        system=prompt_config["system"],
        feature="document_extraction"
    )
    timings["llm_call_ms"] = round((time.time() - t1) * 1000, 1)

    t2 = time.time()
    result = ExtractionResult(**json.loads(raw))
    timings["validation_ms"] = round((time.time() - t2) * 1000, 1)

    t3 = time.time()
    await save_extraction(result)
    timings["db_write_ms"] = round((time.time() - t3) * 1000, 1)

    timings["total_ms"] = round((time.time() - t0) * 1000, 1)
    logger.info("extraction_timings", extra=timings)

    return result
After a week of production data, query Cloud Logging to build a picture of where time actually goes. In most cases: LLM call is 85–95% of total latency. DB write and validation are noise. That tells you where optimisation effort is worth spending — and it's almost never the validation layer.
Concurrency Configuration
LLM API calls are I/O-bound — the Cloud Run instance is sitting idle waiting for OpenAI to respond. High concurrency is safe:
resource "google_cloud_run_v2_service" "ai_worker" {
  template {
    containers {
      resources {
        limits = {
          cpu    = "2"
          memory = "2Gi"   # SDK + dependencies are memory-hungry
        }
        cpu_idle = false   # keep CPU during LLM wait
      }
    }

    scaling {
      min_instance_count = var.min_instances
      max_instance_count = var.max_instances
    }

    max_instance_request_concurrency = 40   # higher than default for I/O-bound work
  }
}
The real ceiling isn't Cloud Run concurrency — it's the OpenAI API rate limit. If you have 20 instances each handling 40 concurrent requests, that's 800 simultaneous LLM calls. Check your OpenAI tier's requests-per-minute and tokens-per-minute limits before setting max_instance_request_concurrency high. A 429 rate limit error at scale is its own kind of incident.
Closing the Series
Six posts ago, S01E01 named five reasons AI integrations break in production: no output validation, prompts as static strings, no fallback, unmanaged token limits, and unmonitored costs.
This series addressed each one:
S01E02 — output validation with Pydantic, prompts as versioned config, fallbacks that don't mislead
S01E03 — async pipelines that don't block the request path
S01E04 — token counting, per-feature cost tracking, daily budget limits
S01E05 — testing strategy that makes the test suite trustworthy
S01E06 — deployment configuration that keeps the service responsive without breaking the infra budget
An LLM integration isn't fundamentally different from any other external dependency. It needs the same defensive patterns — validation, fallbacks, monitoring, testing — plus a few that are specific to probabilistic systems. The series covered both.